Frequently asked questions
What is the Energy Management Leadership Awards?
The Clean Energy Ministerial (CEM) Energy Management Leadership Awards recognize organizations using an ISO 50001-certified energy management system to save energy and reduce costs. These awards raise global awareness of the benefits of energy management, helping accelerate broad implementation of these proven systems to help meet organizational, national and global energy and climate goals.
Who should apply?
View Who Should Apply in the Official Rules
How do I apply?
View How to Apply in the Official Rules
How are the winners selected?
View Selection Process in the Official Rules
When and how will the winners be announced?
View Global Recognition and Award Notification in the Official Rules
We have a case study already written about our ISO 50001 experiences and results. Can we submit that?
All entries for the Energy Management Leadership Awards should be submitted using the Case Study Template. Existing content can be pasted into this template, though entrants should review the Case Study Topics and Evaluation Criteria and ensure you have addressed the topics to be scored during the selection process.
Must I address every item listed in the CEM case study template?
To be competitive for the CEM Award of Excellence and any applicable national awards, entrants should review the Case Study Topics and Evaluation Criteria and ensure the case study addresses topics to be scored during the selection process.
Can I change the subheadings in my case study or must I use what is in the template?
We encourage organizations to use the headings in the case study template. Organizations are welcome to use additional subheadings.
What is the maximum page or word limit in submittal of a case study?
Case studies must be no shorter than four (4) pages. Six (6) pages is the recommended length. Case studies shorter than 4 pages or longer than eight (8) pages will not be accepted.
What if my organization has multiple sites certified to ISO 50001? Should we submit a case study for each site or can we integrate our sites’ experiences into one case study?
An organization may submit either a single entry that collectively describes ISO 50001 implementation and results for multiple sites or separate entries for its different ISO 50001 certified sites. We encourage you to choose whichever path represents your unique story.
The CEM Energy Management Leadership Awards program has received entries that highlight a variety of approaches to achieve ISO 50001 certification. Previous entrants include companies that establish an EnMS at a corporate level and leverage that EnMS (and associated expertise) across its sites to maximize implementation efficiency and drive the portfolio toward company goals. Individual sites also enter the competition after independently taking on energy management using ISO 50001 and achieving impressive savings, drawing the attention of senior management. Organizations with multiple individual sites individually certified to ISO 50001 also participate, reflecting the outcomes of a broader corporate energy management strategy that supports individual facility action.
In each case, organizations and sites are displaying agility and innovation while tackling challenges and creating solutions that fit. We welcome all ISO 50001 certified organizations to submit case studies for the award program and look forward to learning more about the variety of approaches being used to drive value within the organization through ISO 50001.
Guidance on developing your case study: Regardless of the path you choose, case studies should describe the strategy and decision for pursuing certification(s) and how it relates to a business, corporate, and/or site strategy.
For entries with multiple sites:
- If you choose to submit a case study that addresses a corporate energy management system with multiple sites included within the scope of the ISO 50001 certificate, the case study entered needs to cover the entire full scope of the certification (i.e., not a subset of the sites).
- If you submit a case study describing ISO 50001 implementation and results for multiple sites, a copy of each relevant site’s ISO 50001 certificate is required.
- Quantitative results can be provided in aggregate, averaged, or separately by site (e.g., for the “Case Study Snapshot” box included in the Case Study Template, organizations can enter an aggregate, average, or several individual site results for the following fields: energy performance improvement, annual energy cost savings, cost to implement, and payback period). Results for sites outside the scope of the entry should not be included.
- In the “Case Study Snapshot” box, a summary may be included for industry and location (e.g., 4 sites in Sweden, 2 sites in Korea, 3 sites in the United States).
- Photos of different sites may be included throughout the case study.
An individual facility covered under a corporate or multi-site ISO 50001 certificate may apply and submit a case study for its facility accomplishments in certain cases. The facility needs to be indicated on the corporate ISO 50001 certificate provided in the entry. If the corporate entity is also applying for an award, then the facility’s entry must not be duplicative with the organization’s entry (i.e., they cannot submit two entries and case studies based on the same ISO 50001 certificate). If the corporate entity received an award in a previous year for a multi-site ISO 50001 entry, and a facility from that multi-site ISO 50001 certificate wishes to apply this year, then the facility is not eligible if it submits the same ISO 50001 certificate that the corporate entity provided in the previous year.
Contact the awards administrator for further questions.
What does “accredited” certification body mean? Accredited by whom?
Certification bodies are accredited by Accreditation Bodies that are members of the International Accreditation Forum (IAF). The primary function of IAF is to “develop a single worldwide program of conformity assessment which reduces risk for business and its customers by assuring them that accredited certificates may be relied upon.” Accreditation ensures that the certification body has been independently evaluated against internationally recognized standards to conduct ISO 50001 audits with impartiality and competence. Accreditation provides confidence in certification outcomes.
Organizations entering the awards program must have ISO 50001 certificates issued by an accredited certification body. Once organizations submit their entry and ISO 50001 certificate(s), the awards administrator will identify the body that accredited the certification body, determine if the accreditation body is an IAF member, and confirm that the certification body’s accreditation is current. If the certificate does not readily identify the accreditation body, the awards administrator may inquire further with the certification body to verify its accreditation status for ISO 50001, and whether the scope of accreditation covers the applicant’s country.
View Accreditation Body members of IAF, listed by country.
Can I apply for an award if my organization participated in a previous year?
Previous award recipients may enter the 2024 awards program if:
- the scope and boundaries of the EnMS have changed (e.g., an expanded scope from single facility to multiple or certification of a different facility within the organization) or
- after recertification to ISO 50001.
The program does not accept re-entry of case studies that received awards from this program in past years (i.e., revised versions of case studies that address the same scope and boundaries and include the same ISO 50001 certificates). Organizations that have previously won an Award of Excellence in Energy Management are not eligible for the 2024 Award of Excellence, but they may receive an Insight Award.
What is the terminology used in describing energy performance improvements in the case study?
The following guidance is intended to provide common understanding of energy performance improvement concepts.
Energy Performance Improvement Concepts
Energy savings represent the amount of energy saved (i.e., energy not consumed) as result of implementing an intervention, such as an energy performance improvement measure, action, or project. Energy savings cannot be directly measured because they represent the avoided/absent use of energy. Therefore, energy savings must be estimated by comparing energy consumption before and the energy consumption after the implementation of the intervention, whilst ensuring normalization for factors and conditions that affect energy consumption and that cannot be controlled (e.g., weather, production volumes, occupancy rate, quality/properties of raw materials, etc.).
Normalization is the term used to indicate the process of ensuring that comparison of energy consumption and/or performance before and after an intervention is carried out under equivalent conditions. When conditions before and after the intervention are different (e.g., changes in volume of production this February compared to February last year; this winter is much colder than last year; humidity or fat content of our input raw material is significantly higher/lower than last year; etc.), then normalization ensures that the comparison accounts for these differing conditions. Normalization processes always involve either the modification of data or the development of energy consumption and/or performance models. ISO 50001:2018 refers to normalization with regard to establishing energy performance indicators and energy baseline as follows:
6.4 Energy performance indicators
“…. Where the organization has data indicating that relevant variables significantly affect energy performance, the organization shall consider such data to establish appropriate EnPI(s)….”
6.5 Energy baseline
“…Where the organization has data indicating that relevant variables significantly affect energy performance, the organization shall carry out normalization of the EnPI value(s) and corresponding EnB(s)…”
Baseline period indicates a specified period of time used as reference for energy consumption and/or energy performance analysis, associated data collection efforts, and comparison of energy consumption/performance with and without individual or groups of improvement measures.
Reporting period indicates a specified period of time over/for which energy consumption/performance is compared to the baseline.
Can I see an example of how to calculate energy performance improvement using normalization?
A facility is assessing its energy performance improvement of 2020 compared to 2019 and wants to normalize the assessment for relevant variables affecting energy consumption.
The facility identifies production and hot weather as relevant variables that have significant impact on its energy consumption and that are routinely changing. The effect of hot weather on energy consumption is commonly calculated using cooling degree days (CDD).
The following table summarizes the facility’s monthly consumption of electricity, production of widgets, and monthly cooling degree days. The facility personnel used online weather data resources to determine the cooling degree days for the facility’s location for each month in 2019 and 2020.
| Electricity (kWh) | Production (units) | Cooling Degree Days | |
| 2019 | |||
| January | 1,660,345 | 135.90 | 3 |
| February | 1,791,891 | 140.80 | 0 |
| March | 2,902,315 | 357.48 | 8 |
| April | 3,429,380 | 395.37 | 214 |
| May | 4,471,930 | 551.24 | 437 |
| June | 4,671,681 | 527.54 | 494 |
| July | 4,464,334 | 453.27 | 604 |
| August | 4,611,053 | 513.41 | 501 |
| September | 3,270,859 | 348.21 | 362 |
| October | 2,201,236 | 201.97 | 173 |
| November | 2,949,767 | 332.05 | 46 |
| December | 2,861,784 | 379.35 | 1 |
| 2019 Totals | 39,286,575 | 4,337 | 2,843 |
| 2020 | |||
| January | 1,681,936 | 143.88 | 0 |
| February | 2,225,443 | 232.76 | 4 |
| March | 3,540,810 | 467.44 | 2 |
| April | 2,480,562 | 246.16 | 138 |
| May | 3,648,867 | 380.73 | 471 |
| June | 4,416,528 | 568.16 | 568 |
| July | 2,848,464 | 271.68 | 586 |
| August | 2,562,714 | 217.01 | 534 |
| September | 2,277,148 | 212.37 | 302 |
| October | 1,361,498 | 144.96 | 180 |
| November | 1,712,562 | 172.00 | 102 |
| December | 1,397,971 | 169.27 | 14 |
| 2020 Totals | 30,154,503 | 3,226 | 2,901 |
The facility used its 2019 data and Microsoft Excel Data Analysis Regression tool to develop an equation to model its 2019 electricity consumption. This equation models the facility’s 2019 electricity consumption as a function of its two relevant variables, production and CDD:
2019 Electricity Consumption (kWh) = 5,342*Production + 1,682* Cooling Degree Days + 944,757
- 5,342 is the incremental energy consumption per unit of production
- 1,682 is the incremental energy consumption per cooling degree day
- 944,757 is the base load energy consumption not related to relevant variables
To determine whether the facility improved its energy performance, staff used the 2019 Electricity Consumption equation to begin assessing energy performance for 2020. Production was higher in January 2020 compared to January 2019 due to demand of a new customer, while CDD was lower due to slightly colder weather conditions.
To account for these different conditions and normalize the energy performance assessment, the facility did the following:
1) Inserted the January 2020 Production and CDD values in the 2019 Electricity Consumption equation to calculate the Expected electricity consumption, i.e., what its 2019 electricity consumption would have been with Production and CDD values from January 2020.
Expected electricity consumption = 5,342*143.88 + 1,682* 0 + 944,757 = 1,713,364
2) Compared Actual electricity consumption with Expected electricity consumption.
1,681,936 – 1,713,364 = – 31,428 kWh
The Actual vs Expected comparison yields a negative value, which means that an improvement was achieved. In other words, the facility achieved electricity savings under equivalent relevant variable conditions in January 2020 and improved its energy performance in January 2020 compared to the 2019 performance.
The facility repeated the process for the following month to assess its February 2020 energy performance compared to that of 2019.
In February 2020, both Production and CDD were higher than values in February 2019. To account for these different conditions and normalize energy performance assessment, the facility did the following:
1) Inserted the February 2020 Production and CDD values in the 2019 Electricity Consumption equation to calculate the Expected electricity consumption, i.e., what its 2019 electricity consumption would have been with Production and HDD values from February 2020.
Expected electricity consumption = 5,342*232.76 + 1,682* 4 + 944,757 = 2,194,889 kWh
2) Compared Actual electricity consumption with Expected electricity consumption
2,225,443 – 2,194,889 = 30,554 kWh
In this case, the Actual vs Expected comparison yields a positive value. This means that under equivalent relevant variable conditions, the facility consumed more electricity in February 2020 and that it worsened its energy performance in February 2020 compared to its 2019 performance.
The facility repeated the same procedure for the remaining 10 months of data for 2020 to determine Actual and Expected electricity consumption for those months. Then, they added up the results of the 12 comparisons as follows:
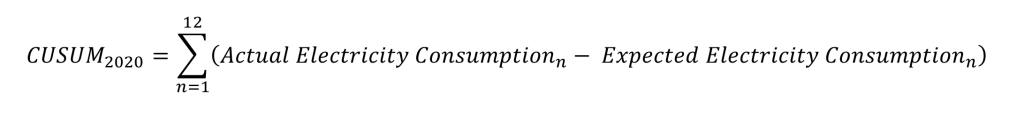
A negative CUSUM2020 value indicates the normalized total electricity savings compared to 2019 energy performance. A positive CUSUM2020 indicates normalized total electricity overconsumption compared to 2019 energy performance.
In order to quantify the annual energy performance variation rate, the facility divided CUSUM2020 by the annual Expected electricity consumption:
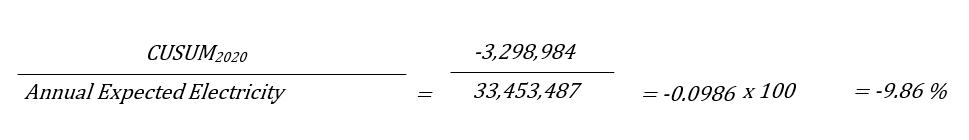
In 2020 the facility consumed 9.86% less electricity than in 2019 under equivalent relevant variables conditions, e.g., electricity performance improved by 9.86%.
It is to mention that this example facility also consumes natural gas. A regression model was developed also for natural gas consumption. Separate regression models must be developed for different energy sources, and relevant variables can be different for each energy source/model.
Energy savings for different energy sources are then to be combined to get the overall energy performance improvement of the facility/organization.
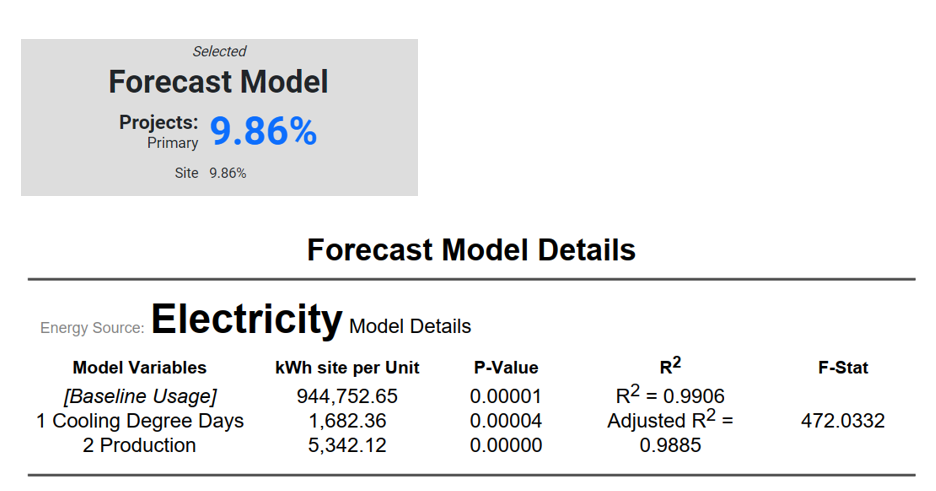
Some resources and tools are available to help organizations with normalization and energy performance calculations. For example, the EnPI Lite tool is a resource of the U.S. Department of Energy’s Advanced Manufacturing Office that allows organizations to calculate their annual energy performance variation using regression analysis. The tool develops a regression-based model for each energy source and uses statistical validity checks to ensure models are valid.
The facility from the previous example applied its 2019 and 2020 data to the tool. Details of the statistical validity checks are also provided.
If your organization uses other methods than noted above and wish to include this in the case study, please provide rationale and fully explain the calculation of energy performance improvement, for review by the selection committee. If the organization did not use normalization in estimating its energy savings and energy performance improvement, then the organization should provide rationale explaining why normalization was not needed.
Our company won’t allow us to disclose financial information such as cost savings and expenditures, but we can provide information on energy savings in megawatt hours (MWh). Can I still participate in the awards program? Will I lose points for not sharing this information?
Yes, you can still participate. If sharing this information is not an option, we recommend providing the payback period on the ISO 50001 EnMS implementation that normalizes the economics without having to share absolute or specific financials. A simple payback period can be calculated by using the following formula: Payback Period (years) = Cost to implement EnMS/ Annual operational energy savings. In the Case Study Template: In the table titled “Case Study Snapshot” add a row at the bottom; in the left column enter: “Payback Period (years)” and in the right column: enter your payback period. In the Entry Form, leave the relevant financial cell empty and in Row 74: enter “Payback Period (years)” (under Cost to Implement EnMS) and then enter the year(s) in the text field column N.
For points, this program asks for the financial information to provide a full story of the value of using an ISO 50001 EnMS – these case studies are helpful and insightful for other organizations that are considering ISO 50001. Payback period will be accepted though full points might not be awarded. That said, the numbers are one part of the story and should be well supported for either financial information or payback period. Please make sure to review the evaluation criteria and address the case study topics as completely as possible.
I have more questions about this Energy Management Leadership Awards competition.
Please carefully review the Official Rules and our Frequently Asked Questions (FAQ). For additional questions, contact the awards administrator at EMWG@energetics.com. When appropriate, the awards administrator will share new questions (without attribution) and answers via email to organizations that requested updates and via clarifications added to this list of FAQs.